The Sorting Investor & The Hidden Cost of Recency

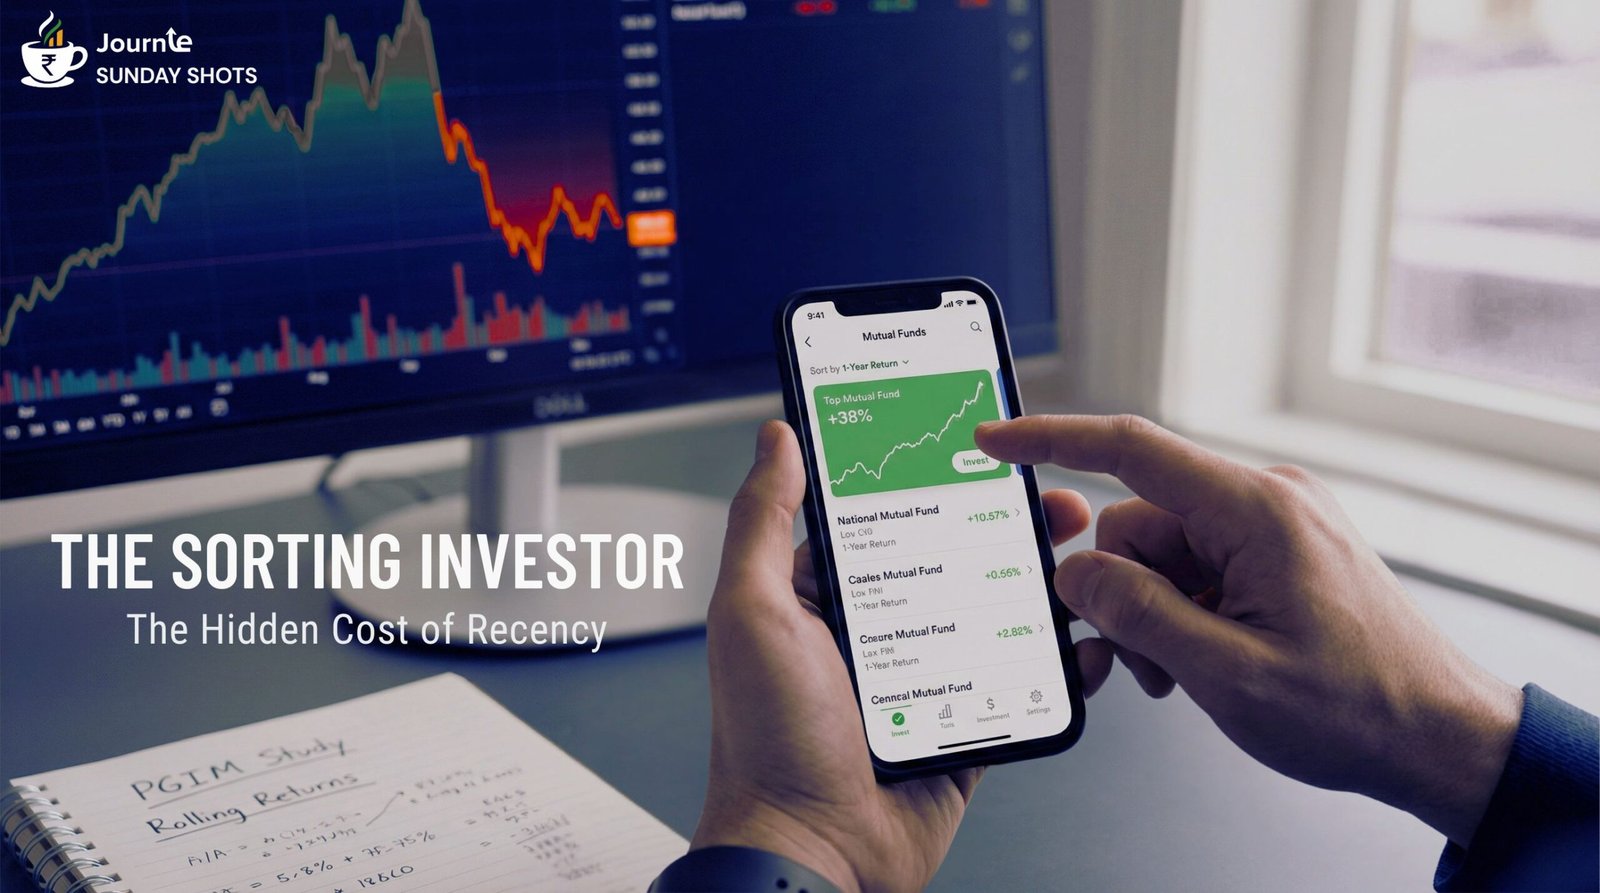
Ever opened an investing app, sorted by “1-year returns,” and felt that sense of satisfaction picking the fund at the top?

That feeling is familiar. It’s human. And it’s where things start going wrong.

Recently, Radhika Gupta, CEO of Edelweiss Mutual Fund, put a name to this behaviour: “The Sorting Investor.”

It landed because it described something most investors do, often without realizing it.

They don’t speculate. They don’t gamble. They don’t chase tips.

They simply sort and choose – by returns, by rankings, by whatever sits at the top

Clean. Logical. Efficient. It feels like how smart people should invest.

The data, however, tells a very different story.

Meet the Sorting Investor

Imagine Raj. He’s a CFO — sharp, analytical, careful with money. He has ₹50 lakh of surplus cash to deploy.

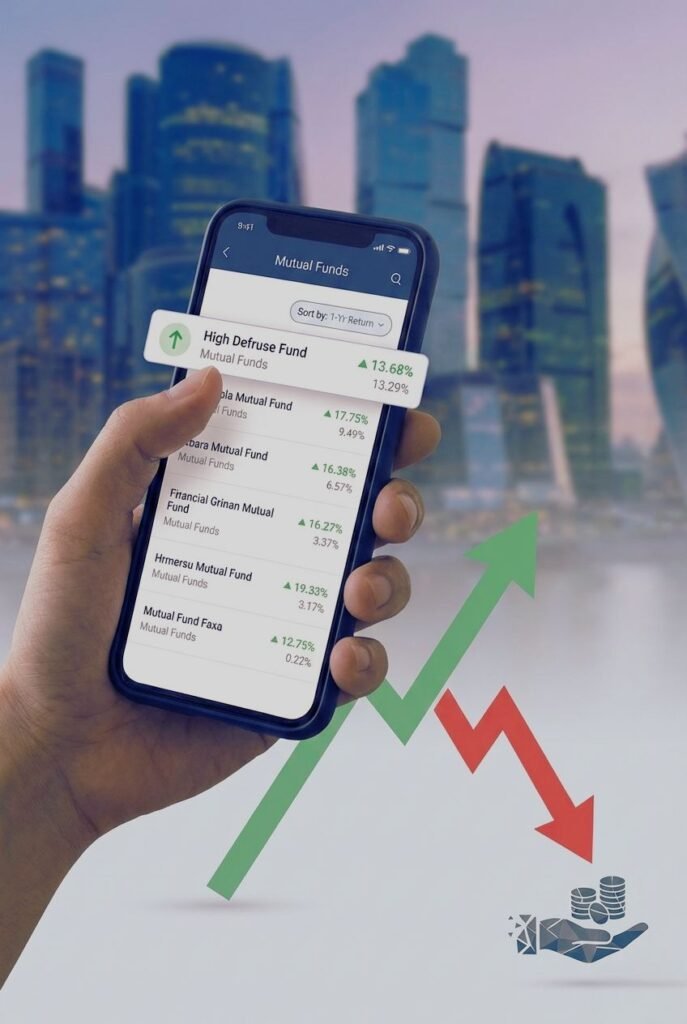
On a Sunday evening, he opens his investment app and sorts equity funds by last year’s returns.

A Mid cap fund stands out — up nearly 38%. Clean chart. Top rank. Easy decision.

Raj invests. And three months later, market leadership shifts. Large caps gained strength as midcaps cooled off. The fund slips down the rankings.

Raj switches. Buying high, selling low, without realizing it.

Nothing reckless. Nothing emotional. Just one reasonable decision after another.

How Sorting Became the Default

This wasn’t always the norm.

Sorting investors didn’t emerge because people became careless. They emerged because information became abundant and interfaces trained their behaviour.

Today, every platform leads with performance tables, media headlines celebrate annual winners and fund factsheets open with recent returns

Over time, a simple idea gets reinforced: The best fund is the one that did best recently.

So, investors optimize for visibility, not durability.

What the Data Actually Says

Here’s what the data showed. Studies tracking mutual fund rankings over time, show a consistent pattern:
  • Funds at the top of rankings frequently fell sharply the following year
  • Many slipped into the bottom of the performance
  • Even over three-year windows, leadership changed frequently
  • Only a small fraction of top-ranked funds repeated their performance
PGIM India’s recent study sliced through 10+ years of fund rankings. And the pattern is brutal:

From Top Rank Next Year Reality
#1 Funds 80% drop to mid/bottom
Top 10 Only 20% repeat

Top funds tumble. Bottom ones often rebound. Leadership flips every cycle—not because managers forget how to invest, but because markets reward different styles each year.

The Illusion of Intelligence

Sorting feels analytical. But notice what usually gets ignored:

  • How did this fund behave during stress?
  • How wide are its outcomes?

How often does it beat its benchmark? Instead, the question becomes: “Who looked smartest last year?”

That’s not investing. That’s pattern-chasing.

Sorting by recent returns assumes continuity. Markets specialize in breaking it.

Recency bias makes investors think recent winners are safer bets despite no statistical evidence.

The Metric That Changes the Conversation

This is where the lens changes.

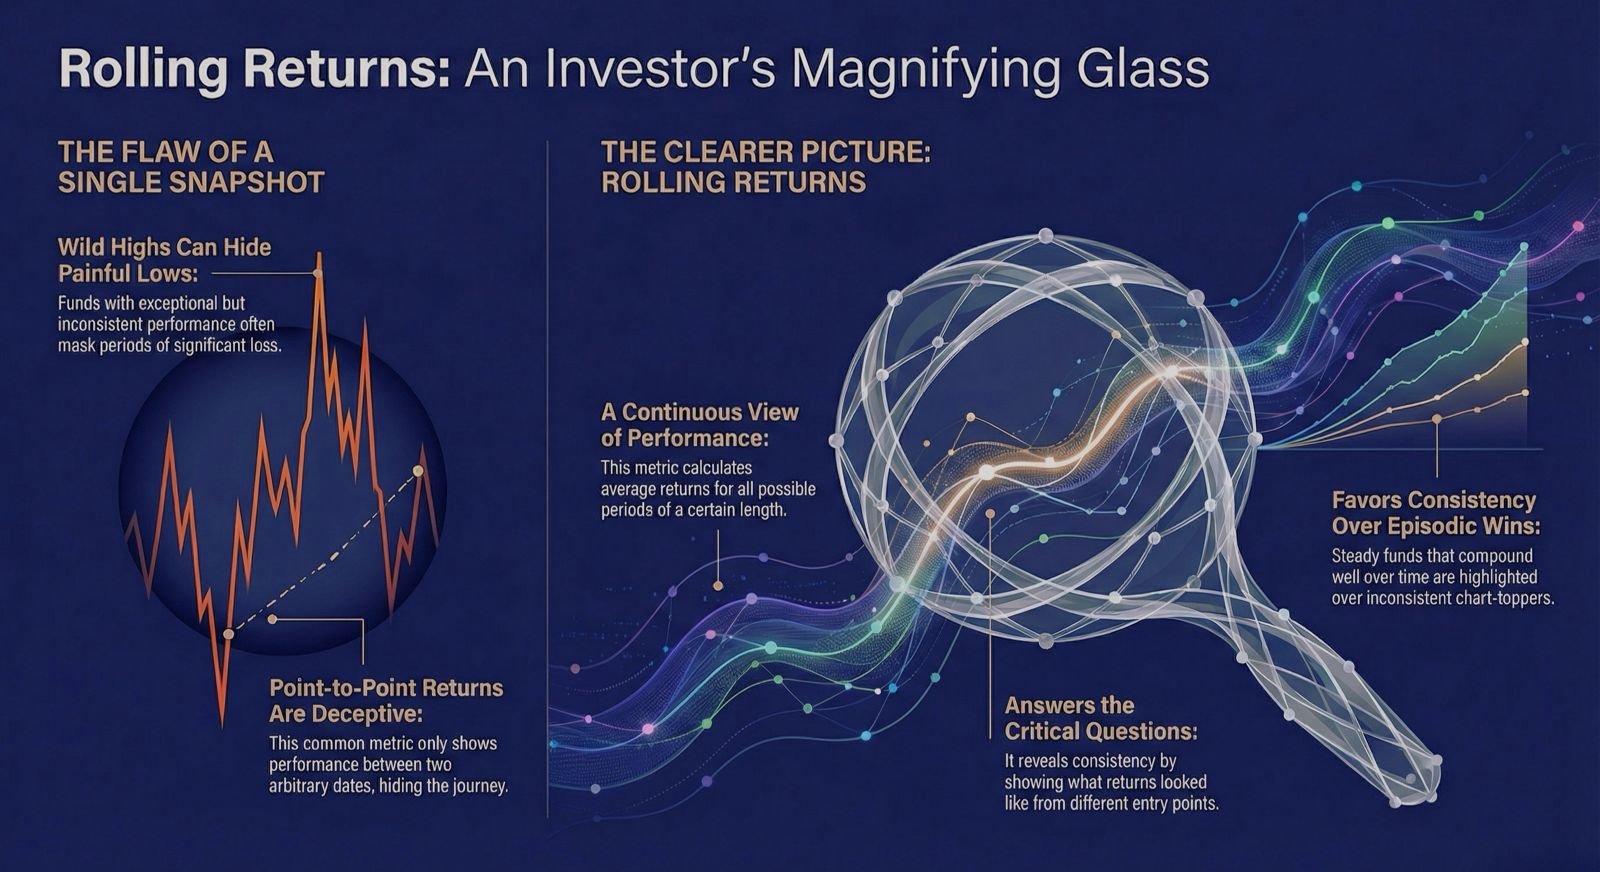
Rolling Returns – A favourite metric of Experienced investors.

Instead of point-to-point returns, Rolling Returns is a better way to understand the performance of a fund. It answers the uncomfortable questions like:

  • What did returns look like across different entry points?
  • How bad did the worst periods get?
  • Was the performance consistent, or episodic?

Rolling Returns explain the performance of funds, not by one good year, but by consistency across many imperfect ones.

Funds with wild highs often hide painful lows. Steady ones rarely top leaderboards but compound better over time.

The Consistency Problem

Here’s where the story gets harder.

Across markets, a majority of actively managed funds struggle to beat their own benchmarks over extended periods. In fact, scorecards published by S&P Dow Jones Indices repeatedly show that roughly two-thirds of active equity funds underperform their benchmarks over longer horizons.

Now, this isn’t a judgement on fund managers. It simply reflects how difficult consistency can be over long periods.

Which is why, at Journie, our approach leans toward index-based portfolios and/or optimal asset allocation — reducing fund-manager bias, anchoring portfolios to a defined investment philosophy, and evaluating the outcome over 3, 5 and 10-year rolling periods, not headline returns.

It’s less about chasing skill, and more about structuring behaviour.

The Hidden Cost of Sorting

The real cost of being a sorting investor doesn’t show up immediately.

It’s gradual and shows up over time as:

  • Entering after strong runs
  • Exiting during inevitable underperformance
  • Constant portfolio churn
  • And broken compounding
  • Higher tax cost

The portfolio moves. The wealth doesn’t.

From Sorting to Staying: The Investor Shift

We’re in a phase of sharp market rotations and uneven leadership.

This is exactly when sorting behaviour peaks and exactly when it does the most harm.

Thoughtful investors don’t stop using data. They stop letting data rush them.

They don’t try to predict which fund will win next year. They choose funds whose behaviour they understand, and then give them time.

Leaderboards create movement. Processes create wealth.

And the difference between the two is usually visible only in hindsight.

Until Next Sunday!

Disclaimer: This update is for informational purposes only. Please consult a SEBI-registered advisor before investing.

Recent Blogs

The Great Salary Reset: India’s 8th Pay Commission and the Next Income Cycle

8th pay commission

As 2026 unfolds, imagine millions of households of government employees unwrapping not just resolutions, but fatter paychecks that could light up India’s economy like Diwali fireworks.

But before we begin, we wish you and your family a Happy New Year.
May the year ahead bring health, happiness, and the quiet comfort of time well spent with those who matter most.

We start the year with an important story unfolding across India’s economy: the 8th Pay Commission — a once-in-a-decade income reset that shapes incomes, consumption, and broader economic momentum.

A Significant Reset, Not Just a Raise

Once every ten years, the Indian government hits the reset button, undertaking a comprehensive overhaul of salaries and pensions for its employees through a Pay Commission. This isn’t a marginal adjustment. It’s a structural reworking of how the Centre compensates its workforce.

The 8th Pay Commission formally comes into effect from January 1, 2026. That doesn’t mean revised salaries show up immediately. Recommendations, approvals, and implementations roll out over the year — but the framework is now live.

And this matters, as the scale is massive. Around 5 million central government employees and 6.5–7 million pensioners could see their pay and retirement benefits meaningfully recalibrated over this cycle. External estimates place the fiscal cost near ₹3-4.5 trillion, roughly 0.6-1.1% of GDP, spread across the implementation period.

While the recommendations apply to the Centre, state governments and public sector undertakings often align their pay structures over time, extending the impact well beyond the central payroll.

Taken together, this suggests that close to 30 million employees across government and allied entities, representing roughly 5% of India’s working population, could be directly influenced by this income reset.

Fitment Factor: The Multiplier That Shapes Outcomes

At the heart of this reset sits a single variable: the fitment factor.

In simple terms, it works like this:

Old Basic Pay × Fitment Factor = New Basic Pay

The mechanics are straightforward. The implications are not. Even small changes in this multiplier translate into meaningful shifts in take-home pay across millions of households.

While the final number for the 8th Pay Commission is yet to be determined, discussions and early estimates suggest a broad range of 2-2.5, depending on inflation trends, negotiations, and the government’s fiscal comfort.

In practical terms, that could imply:

    • A 20–30% increase in overall pay levels over the current structure
    • A material upward revision in minimum basic pay from current levels

The exact outcome will depend on where the fitment factor ultimately settles. But even modest changes, applied at this scale, carry significant economic weight.

DA, Pensions, and the Compounding Effect

Beyond headline pay revisions, inflation-linked components like Dearness Allowance (DA) and Dearness Relief (DR) add another layer to this story.

Ahead of the reset, DA for central government employees is already tracking in the mid-50s as a percentage of basic pay, and could be higher by the time the 8th Commission fully kicks in — which means the post-reset progression of DA again becomes a powerful second leg of the income story.​

Even incremental adjustments here can move take-home pay meaningfully, sometimes well before full commission recommendations are implemented. Pensioners, are part of this cycle too.

As salaries reset, pensions typically follow, effectively extending the income impulse deeper into semi-urban and smaller-town ecosystems where many retired employees reside.

Echoes From Past Cycles

Markets have seen this before. The 7th Pay Commission, for instance, translated a 23.55% increase in overall emoluments for about 4.7 million employees and 5.2 million pensioners, lifting government wage and pension outlays and adding a visible boost to urban consumption.​

The pattern was similar during the 6th Pay Commission cycle, which also coincided with a visible pickup in urban consumption.

Higher salaries translated into stronger demand for housing, automobiles, discretionary spending, and financial savings. Retailers, lenders and market observers at the time flagged a clear uptick in demand for vehicles, white goods and housing loans as arrears and higher salaries began to flow through.​

Past pay cycles have added an estimated 0.6–0.8 percentage points to GDP growth through the consumption channel over a few years, depending on arrears timing and implementation.​

Why This Matters Beyond Government Wallets

Most commentary treats the Pay Commission as a government employee story. That framing misses the point. The broader lens is macroeconomic.

First, consumption. A meaningful rise in incomes across millions of households tends to show up quickly in spending — homes, cars, travel, and discretionary categories. This is real demand entering the system, not stimulus created on paper.​​

Second, savings and capital flows. Higher take-home pay and improved pensions don’t get spent entirely. A portion consistently finds its way into bank deposits, insurance products, and market-linked assets, shaping flows across equities and long-term savings instruments.

In capital markets, previous pay cycles have coincided with stronger inflows into mutual funds, insurance and long-term savings products, as a slice of higher, more predictable income gets formalized rather than left in idle cash balances.​

Third, the fiscal balancing act. Earlier commissions have pushed the Centre’s wage bill higher by around 0.6–0.8 percentage points of GDP, with the last cycle taking it close to 3% of GDP.

State finances tend to bear an even larger cumulative share once they align their pay scales. Higher wage and pension bills force trade-offs — stronger revenue mobilization, tighter non-priority spending, or acceptance of a slightly wider deficit.

The Rate Cycle Tailwind

This income reset is also landing at a supportive macro moment.

Over the past year, the Reserve Bank of India has decisively eased policy rates, with the repo rate moving from 6.5% to 5.25% as inflation moderated. Lower borrowing costs, combined with improving real incomes, tend to reinforce consumption and risk appetite.

When income certainty improves alongside easier financial conditions, households do not just spend more. They commit more. Longer EMIs feel manageable. Market-linked savings feel less intimidating. The marginal decision shifts.

8th pay commission

What This Means for Capital

The relevance of the 8th Pay Commission. lies well beyond salary tables.

A broad-based income reset changes behaviour at the margin. It nudges savings away from idle balances. It increases comfort with long-duration commitments. It creates a steady tailwind for consumption-linked sectors and formal financial assets.

These shifts don’t arrive overnight. But they are visible, repeatable, and historically consistent.

As 2026 unfolds, this reset may prove to be one of the year’s most under-appreciated forces shaping economic sentiment — and capital flows.

Until next Sunday!

If you enjoy reading Sunday Shots — share it among your friends, family, or even strangers on WhatsApp, LinkedIn, and X.
Good insights travel best through good company.

Primary inspiration and select data points: “The Great Salary Hike: Inside the 8th Pay Commission”, Kotak Mutual Fund, December 2025.
Additional sources: Finance Ministry disclosures (Lok Sabha, December 2025), RBI Annual Report FY17, RBI policy updates, Bajaj Finserv, and other public sources.

Disclaimer: This update is for informational purposes only. Please consult a SEBI-registered advisor before investing.

Recent Blogs

From Excel to Control Tower – The Startup Treasury Upgrade

10 AM. Coffee in hand. You’re staring at a dashboard that doesn’t exist yet.

The business is running. Revenue is coming in. The runway looks okay.

But one question refuses to go away:

Where is our cash really? And what is it doing for us right now?

This is a familiar moment for startup founders and finance leaders once the business moves past survival mode. Cash is no longer pocket change, but the systems around it still feel improvised.

The System Every Startup Relies On

Walk into most startup finance setups and you’ll find the same thing:
a master Excel sheet that decides everything about cash.

It tracks bank balances, expected collections, vendor payments, and a rough sense of runway. Usually updated late at night and often pulled together just before investor updates or board calls.

For a long time, this worked.

In the early stages, speed matters more than structure. Capital feels available. Decisions are instinct-driven. Cash in the bank means safety.

Treasury isn’t a function. It’s a task.

But as startups grow, hire more people, manage multiple accounts, and handle uneven cash inflows, that same Excel sheet softly becomes the most important and yet fragile system in the company.

What’s interesting is this: many startups today are holding more cash than they did a few years ago, yet managing it with the same early-stage processes.

The money evolved. The system didn’t.

The Soft Upgrade: From Cash Box to Control Tower

What’s changing isn’t just how much cash startups hold. It’s how intentional they’re becoming about managing it.

More founders are realizing that treasury isn’t just about returns. It’s about visibility, timing, and avoiding surprises.

Instead of asking: “How much do we have in this account?”
They’re asking: “What happens to runway if collections slip by two weeks?”

Instead of: “Can we earn a little extra yield?”
They’re asking: “Is idle cash sitting in the right place given what’s coming up?”

This shift doesn’t require a treasury desk or complex systems. It starts with a simple mindset change:
Treat cash like a living system, not a static balance.

The stress doesn’t show up on calm days. It shows up when a delayed customer payment, a large vendor bill, and an investor update land in the same week.
That’s when the old setup starts to creak.

The Three Dials That Matter for Startups

Strip away the jargon, and most future-ready startup treasuries are tuning just three dials: Visibility. Predictability. Rules.

1. Visibility: One Clean View of Cash

Startups rarely suffer from a lack of cash. They suffer from not knowing where it all sits.

Money gets spread across current accounts, FDs, debt funds, receivables, and advances. Each with its own login, statement, and update cycle.

Individually manageable. Collectively confusing.

The upgrade is simple: a single view that tells you, at any point,

Here is your cash by bucket — operating, near-term, core. And here’s how it has moved this week, quarter or entire financial year.

2. Predictability: A Runway Story, Not Just a Balance

A bank balance tells you where you stand today.
A cash-flow view tells you how much room you really have.

More startups are adopting rolling forecasts, often just 12–13 weeks, updated weekly. Not to be precise, but to be prepared. It connects sales, collections, vendor terms, loan repayments, interest, capex, and taxes into one coherent story.

No hero spreadsheets. No complex models.
Just a rhythm of looking ahead, adjusting early, and avoiding surprises.

3. Rules: Deciding What Cash Is Allowed to Do

Once visibility and predictability improve, the real upgrade comes from rules.

Instead of ad-hoc decisions like “park the surplus somewhere for now”, startups benefit from a simple playbook:

    • X months of operating buffer that stays safe and liquid.
    • Y months of core surplus that can be parked more efficiently into slightly higher-yielding, still-conservative options.
    • Z that’s been kept flexible for opportunities or shocks like acquisitions, down cycles, or strategic bets, with clarity on how quickly it can be pulled back.

Once rules exist, cash decisions stop being reactive. They become repeatable.

And that’s exactly what founders need when things get busy.

A Lighter Cockpit, Not a Control Room

The immediate reaction is predictable:
“This sounds great, but we’re still a startup and don’t have the size or team to build a treasury centre.”

And that’s the point.

You don’t need a treasury department.
You need just enough structure to remove uncertainty.

For many startups, that looks like:

    • One shared cash dashboard
    • A 30-minute weekly review of the next 12 weeks
    • A short-written note on where money can and can’t go

From there, structure grows naturally with scale.

The foundation remains the same: clarity, rhythm, and rules.

We see this shift up close. At Journie, much of our work today sits inside startup treasuries — helping businesses move from fragmented cash tracking to clearer visibility and more deliberate decision-making.

The tools matter, but the discipline they enable matters more.

Closing Thought: The Dashboard as a Mirror

Every phase of a startup has a different obsession.

Early on, it’s product-market fit. Then it becomes growth and burn. Then runway.

This phase is making the cash dashboard the new mirror. A daily reflection of how prepared, honest, and intentional the business really is.

Most startups already have the ingredients. Data. Intent. And often, more cash complexity than they realize.

The real question is simple: Will cash remain a number spread across accounts, or finally be treated as a system?

Until next Sunday — here’s to systems, processes, and the changes that are inevitable.

If you enjoy reading Sunday Shots — share it among your friends, family, or even strangers on WhatsApp, LinkedIn, and X.
Good insights travel best through good company.

Disclaimer: This update is for informational purposes only. Please consult a SEBI-registered advisor before investing.

The Patience Premium: The Fed, the RBI, and Two Very Different Rate Stories

There’s a ritual the markets follow every time the US Fed speaks.
Screens light up, forecasts shift, and for a brief moment, it feels like the entire world is waiting for a single sentence that could move money everywhere.

This week was no different — except for one subtle twist:
the message behind the policy mattered far more than the policy itself.

The Fed cut rates by 25 basis points — a continuation of the slow, measured easing cycle it began earlier this year.

But instead of the clarity markets were hoping for, the Fed delivered something else entirely:
patience, caution, and a reminder that this cycle isn’t following the usual script.

And just like that, the global conversation changed.

The World Expected a Sprint. The Fed Is Signalling a Slow Walk

For months, markets have been building a hopeful narrative. Inflation is cooling. Growth is moderating. Labour markets are easing. Rate cuts, many believed, should now accelerate.

On paper, the Fed’s move aligned with that story. But the tone didn’t.

Policymakers made it clear that future cuts will be slow, limited, and fully data-dependent.
This wasn’t the confident pivot markets have seen in past cycles.
It was a reminder that the Fed is easing because it has to, not because it wants to.

In most cycles, once cuts begin, momentum builds.
This time, momentum is exactly what the Fed is trying to avoid.

Markets wanted conviction. The Fed offered optionality.

Why This Cut Doesn’t Feel Like a Cut

Rate cuts usually trigger a familiar chain reaction:

Lower rates → easier money → stronger risk appetite.

But this time, the headline wasn’t the rate cut. It was the pace of the rate cut.

Investors weren’t responding to the number. They were responding to what the number implied about liquidity in the months ahead. And with the Fed leaning heavily on words like careful and patient, the signal was unmistakable:

Liquidity will return, but it will return slowly.

Not in a flood. Not in a rush. This cycle isn’t about speed. It’s about sequencing.

Not every economy is moving to the same rhythm.

While the US is easing cautiously, India has taken a more confident step forward last week with its own 25-basis-point repo rate cut to 5.25%. The difference lies in the backdrop.

The RBI described India as being in a “rare goldilocks moment”
steady growth, moderate inflation, strong external buffers, and a banking system in far better shape than a few years ago.

This wasn’t a defensive cut. It wasn’t a reaction to weakness. It was a strategic nudge to support momentum.

For India, the implications are clear: slightly cheaper borrowing, healthier credit demand, and support for rate-sensitive sectors like housing, autos, and infrastructure.

So yes, both the Fed and the RBI cut rates, but for entirely different reasons.

That divergence is precisely what makes this cycle so unlike any other.

The Unpredictable Part: Behaviour

If markets feel more sensitive than usual, it’s because they are.

Every data point now becomes a story about future liquidity. Slightly hotter inflation suggests cuts may slow. Softer jobs data raises hope of faster easing. A cautious central bank statement reintroduces uncertainty.

The data moves the markets, yes.
But the interpretation of that data — the psychology behind it — is doing just as much work.

This isn’t just a monetary cycle. It’s an emotional one. And emotional cycles reward a different kind of discipline.

The Patience Premium

In the past, speed was rewarded.
React early. Anticipate the turn. Capture the upside before everyone else.

But this time, the edge belongs to those who can wait.
Wait for clarity. Wait for liquidity to stabilize. Wait for the noise to settle.

The Patience Premium comes from recognizing that rate cuts won’t be rapid, liquidity won’t return in a straight line, central banks aren’t aligned, and markets will continue to swing on every nuance of language.

Patience isn’t passive anymore. It’s strategy.

So What Does This Mean Going Forward?

This isn’t a moment for bold forecasts or loud conclusions. It’s a moment for perspective.

Volatility today isn’t a sign of trouble; it’s the texture of a market in transition. Liquidity-sensitive assets will continue to react the fastest. Fixed income is entering an interesting phase as yields recalibrate, and the next chapter for markets will be shaped not just by the direction of rate cuts, but by the pace and philosophy behind them.

The smartest investors aren’t trying to predict the exact month of the next cut. They’re preparing for the environment that emerges once the noise fades and the cycle begins to reveal its underlying shape.

Until next Sunday — Here’s to staying patient, staying grounded, and seeing the cycle beyond the headline.

If you enjoy reading Sunday Shots — share it among your friends, family, or even strangers on WhatsApp, LinkedIn, and X.
Good insights travel best through good company.

Disclaimer: This update is for informational purposes only. Please consult a SEBI-registered advisor before investing.

The Rupee’s Journey: When 90 Became a Milestone

There are moments in a market cycle when a number stops being a statistic and becomes a story.
Last week, 90 became that number.

For the first time in history, the Indian rupee slipped past ₹90 per US dollar — a moment that felt dramatic for households, symbolic for policymakers, and almost inevitable for markets watching the slow drift through 2025.

This edition breaks down: why we reached this point, why the RBI isn’t panicking, and what this milestone really means for India’s economy and investors.

The Background: How We Reached 90

Through most of 2024, the rupee drifted lower but stayed inside a comfortable range, supported by stable growth and strong FX reserves. In 2025 the script changed. A series of global and domestic pressures slowly built up pressure.

    • A widening trade deficit: India’s import appetite — crude, electronics, gold, capital goods; kept rising even as exports softened. Each month of deficit added pressure: more dollars went out; more rupees chased them.

    • The global dollar wave: Geopolitical tensions and slowing growth across Europe and China drove global investors into the US dollar. When the dollar surges, most emerging market currencies tend to bend. The rupee did too.

    • Foreign outflows: Foreign investors trimmed equity and debt exposure as US yields remained attractive. Outflows amplified pressure on the currency.

By early December, the rupee finally slipped past 90—a psychological line that made years of slow depreciation suddenly feel like a headline.

The Plot Thickens: Why the Rupee Fell Further

Imagine a tug-of-war. On one side: global trade tensions, US tariffs, a surging dollar. On the other: India’s growth story and RBI’s credibility. The rope in the middle is the rupee, pulled hard from both ends.

And this wasn’t an overnight shock; it’s the culmination of a 2025 depreciation trend driven by a perfect storm:

    • Global trade tensions: Steep US tariffs on several categories of imports, and uncertainty around the India–US trade arrangement, weighed on exports and investor sentiment.​

    • Higher import bill, same export base: Oil stayed expensive in rupee terms, and the domestic appetite for electronics and capital goods barely cooled, so the import bill remained elevated even as the rupee weakened.​​

    • Positioning and psychology: As 90 approached, importers rushed to hedge and buy dollars, while exporters delayed conversions, expecting better rates. This created a self-reinforcing squeeze.

In other words, fundamentals started the move; positioning and sentiment finished it.

The RBI’s Strategy: Letting the Rupee Find Its Level

Here’s where the story gets interesting.

Instead of dramatically defending a line in the sand, the RBI has chosen to manage the pace of the move, not the destination.

    • Supporting Exporters: A weaker rupee makes Indian goods and services more competitive abroad — especially in IT, pharma, textiles, auto components and gems & jewellery. For an economy working to diversify exports and deepen manufacturing, this is not a trivial benefit.

    • Prioritizing Growth: With headline inflation trending comfortably below the upper band and growth forecasts upgraded to around 3% for FY26, the Monetary Policy Committee felt it had room to cut the repo rate by 25 bps to 5.25%.
      The message: Do not sacrifice growth just to keep the rupee at a nice round number.

    • Managing volatility, not level: RBI officials have signalled they will calm disorderly moves but won’t peg the currency to a specific value.
      This is the classic managed float approach: intervene when markets misbehave, but let fundamentals and flows decide the underlying trend.

Behind the scenes, tools like FX swaps and Open Market Operations keep rupee and dollar liquidity smooth even as the spot rate adjusts.

What This Means for the Economy

This entire episode is a story of balance—not crisis. The rupee’s fall has winners, losers and trade‑offs:

    • Importers & inflation: Oil, chemicals, machinery, electronics and other inputs become costlier in rupees, and these higher costs can gradually filter into fuel, transport, appliances and everyday goods. The government’s subsidy bill on fuel and fertilisers may also rise if global prices stay firm.

    • Exporters & growth: Exporters earn more rupees per dollar of revenue, supporting margins and, in some cases, expanding hiring and capex. Sectors with natural dollar revenues — IT services, pharma, speciality chemicals — hold up better, while import-heavy and purely domestic firms feel the squeeze.

    • Consumers: Overseas travel, foreign education, luxury imports and tech gadgets become noticeably more expensive in rupee terms. Over time, a sustained weak rupee can subtly shift consumption towards local alternatives where they exist, a boost to domestic producers.​

    • Financial markets: Dollar-earning companies often outperform in weak-rupee phases, while import-heavy or unhedged borrowers tend to come under pressure. In debt markets, lower policy rates support domestic bonds, but global investors remain vigilant about currency volatility.
The Road Ahead: A Delicate Balance

The rupee at 90 isn’t the conclusion of a story; it’s the beginning of a new chapter.

From here, three forces will decide the next chapters: how quickly India can narrow its trade gap, how disciplined global investors remain on India, and how the RBI balances growth with currency and inflation risks.

A credible path on reforms — boosting exports, deepening manufacturing, and reducing energy dependence, will matter more than any single day’s exchange rate print.

These are the levers that will determine whether 90 becomes a temporary checkpoint…or the beginning of a new normal.

Until Next Sunday — Here’s to staying curious, staying calm, and seeing the story behind the headline.

If you enjoy reading Sunday Shots — share it among your friends, family, or even strangers on WhatsApp, LinkedIn, and X.
Good insights travel best through good company.

Disclaimer: This update is for informational purposes only. Please consult a SEBI-registered advisor before investing.

India’s ₹14 Lakh Crore Liquidity Pool: The Unseen Engine of Market Moves

India’s ₹14 Lakh Crore Liquidity Pool

When India Inc’s FY25 balance sheets came in, a clear shift stood out: companies across sectors are holding more cash than at any point in recent years. And this isn’t just caution — it’s reshaping how capital moves through banks, markets and India’s broader growth cycle.

India Inc in 2025 is not short of money; it is short of conviction on when and where to deploy it. This liquidity build-up — across bank books, boardrooms and fund houses, has become one of the strongest forces shaping market behaviour.

The ₹14 Lakh Crore Reservoir

FY25 disclosures show ₹10.67 lakh crore in cash among 3,611 listed non-bank, non-oil & gas firms. Industry reporting through September 2025 places the broader India Inc cash pile near ₹14.2 lakh crore, reflecting later disclosures and a wider corporate universe. Mutual funds, meanwhile, were holding ₹2.0–2.1 lakh crore in cash-equivalent liquidity by Sep–Oct 2025.

Together, this forms a ₹12–14 lakh crore domestic liquidity pool — the largest India has carried in years.

Between FY20 and FY25, corporate cash grew at a ~10.4% CAGR, nearly double the ~5.6% CAGR in outstanding corporate debt. India’s corporates today are net cash builders, not serial borrowers — and that has changed how the entire market behaves.

Why Leadership Is Choosing Cash

By FY25, India Inc had repaired more than its balance sheets — it had reset its risk appetite.

Across sectors, companies strengthened liquidity, reduced leverage and became selective about long-duration projects. Years of volatile commodities, uncertain global demand and unpredictable rate cycles made liquidity more valuable than leverage.

The number of net-debt-free companies expanded sharply from FY20 to FY25. These firms are not hoarding cash out of fear; they are preserving flexibility. They want to invest — but on their terms, not the market’s.

This isn’t crisis-hoarding. It’s opportunity-hoarding — keeping balance sheets light until the right moment appears.

Where the Money Actually Sits

This ₹12–14 lakh crore pool doesn’t lie dormant. It moves — across banks, mutual funds and corporate treasury desks — and each channel influences the market.

    • Banks: A large share sits in current accounts, short-tenor deposits and treasury products. It’s one reason system liquidity stayed in surplus through much of 2025, supported by the RBI’s record dividend (~₹2.69 lakh crore) and periodic liquidity infusions since late 2024.
    • Mutual Funds: Cash-to-AUM ratios climbed through early 2025, and by September–October 2025 equity schemes alone were holding around ₹2 lakh crore, with several flexi-cap and contra funds running double-digit cash while waiting for better valuations.
    • Corporate Treasuries: The rest moves into T-bills, CP/CD markets, ultra-short portfolios and offshore treasury pools. These flows rarely make headlines but influence short-term yields and money-market liquidity every single day.

The cash isn’t idle.
It circulates — and that circulation shapes pricing, sentiment and the speed of market moves.

How This Liquidity Is Bending the Market

With so much money chasing short-term paper, the front end of the yield curve has held firmer than monetary policy alone would imply. Rating agencies noted in 2025 that sustained surplus liquidity compresses spreads on 1–5-year bonds — exactly what the market has witnessed.

In equities, mutual fund cash has become an internal stabilizer. Managers running 5–20% cash buy dips earlier and chase rallies faster — making 2025’s price action as much about domestic allocation timing as earnings or foreign flows.

For corporates, being net-cash-rich simply means choice: refinance when needed, invest when convinced, wait when not.
That patience has slowed a broad capex cycle — but it also sets the stage for a powerful one when conviction returns.

What’s Next — The Two Paths From Here

1. Deployment — A Capex Revival

If global and domestic demand stabilize, and visibility improves, part of this reservoir will move into capex, acquisitions and expansion. Credit demand lifts, long-end yields firm, asset creation rises — and markets get a genuine structural boost.

2. Extended Liquidity Stasis — Drift, Not Growth

If uncertainty persists — globally or at home — companies may continue to treat cash as strategic dry powder. Short-term rates stay soft, lending remains selective, and market moves mirror flows more than fundamentals.

For now, India sits somewhere in the middle. Capex is happening — but not at a scale that defines the cycle.

Why This Liquidity Matters

This liquidity-heavy backdrop changes how both debt and equity behave.

Short-duration instruments remain yield-light because too much money is chasing limited high-quality paper. In equities, corrections are shorter and rebounds sharper because domestic funds deploy quickly.

Sector leadership in the next cycle will depend on where companies finally spend — industrials and infrastructure if capex accelerates; asset-light and consumer businesses if caution persists.

Watching corporate cash, mutual fund cash and system liquidity is now as important as tracking fundamentals.

The Hinge: Confidence, Not Capital

India isn’t short of money — it’s short of conviction.

A ₹12–14 lakh crore reservoir sits across bank books, boardrooms and fund houses, deployed selectively rather than instinctively.

When that money begins to move — driven by clearer global cues, domestic policy visibility or a new wave of projects — the market won’t just turn; it will accelerate.

Until then, the edge lies in reading how India’s liquidity chooses to wait — and being positioned for the moment it doesn’t.

Disclaimer: This update is for informational purposes only. Please consult a SEBI-registered advisor before investing.

Japan’s Rising Bond Yields — The Capital That Built the World Is Coming Home

For nearly three decades, the global financial system quietly relied on one unwavering assumption: Japan would always be the world’s cheapest source of capital.

A country of near-zero rates, near-zero inflation, and a central bank that bought bonds at will.

While the U.S. set the rhythm of global markets, Japan supplied the liquidity.

Its households, pension funds, insurers, and mega-banks sent trillions of yen abroad — quietly financing growth across the U.S., Europe, and Asia. Japanese capital was the silent backbone of the global expansion story.

But what happens when the quietest player makes the biggest move?
This year, we are witnessing that historic pivot.

Japan of Yesterday: The Lost Decades and Zero-Interest Era

To understand today’s seismic shifts, we must first rewind to the early 1990s.

In the late 1980s, Japan experienced a massive asset bubble. Real estate and stock market prices soared to unprecedented levels. But by 1990, the bubble burst violently, plunging Japan into what is now known as the Lost Decades — a prolonged period marked by stagnation, deflation, and weak growth.

In response, the Bank of Japan (BoJ) engineered one of the most radical monetary experiments in modern history — combining a Zero Interest Rate Policy with massive bond purchases and an unprecedented framework called Yield Curve Control (YCC), which directly capped long-term yields near 0%.

This created a unique financial ecosystem where:

    • Borrowing was almost free
    • Long-term bond yields barely moved
    • Investors looked outward to earn returns

Japan gradually became the world’s largest creditor nation, quietly financing global growth while grappling with a debt-to-GDP ratio above 260%.

The Anchor Moves, The Tide Shifts Everywhere

Fast forward to 2025. After decades of near-zero yields, Japan’s long-term government bond yields are surging to multi-decade highs:

    • 10-year JGB yield is around 75%, the highest in nearly two decades
    • 30-year yield has risen above 3%
    • The 40-year yield has touched almost 7%, a record high

Why does this matter?
Because Japan carries a staggering debt load and holds over $3.3 trillion in foreign assets. The BoJ’s decades-long strategy of YCC and ultra-loose policies has been instrumental in sustaining this equilibrium.

However, with inflation rising above 3.6%, and the government unveiling stimulus packages worth over ¥20 trillion, the BoJ has begun tapering bond purchases — signaling an end to “free money” and allowing yields to rise.

A country that kept global borrowing costs suppressed for 30 years is now letting its own cost of money reprice.

When Yields Rise, the World’s Money Comes Home

For years, Japanese investors borrowed yen at near-zero interest and invested overseas seeking better returns — a phenomenon known as the yen carry trade. From Asian equity markets to U.S. Treasuries, Japanese money flowed far and wide.

But rising yields mean rising borrowing costs. Suddenly, the trade becomes riskier, more expensive, and less attractive.

What follows is both predictable and powerful: a capital flow reversal — Japanese investors begin selling foreign assets and bringing money home.

And this matters because Japanese institutions hold:

    • $1+ trillion in U.S. Treasuries
    • Over $3.3 trillion in total foreign assets
    • Trillions more in global corporate bonds, equities, and EM markets

Even a 10% repatriation sends ripples through global markets.

The Global Echo

The effects are unmistakable:

    • Global bond yields could rise as Japanese demand fades
    • Capital-starved emerging markets could face volatility and outflows
    • Currency markets may see the yen strengthen sharply, affecting exports and trade competitiveness
    • U.S. Treasuries and global bonds may experience repricing pressures

A quiet reversal in Tokyo becomes a loud repricing everywhere.

The Japan Policy Dilemma: Inflation vs. Stability

The BoJ and Japanese policymakers face a difficult balancing act:

    • Should they keep yields artificially low to support government debt servicing and social programs?
    • Or allow yields to rise naturally, risking fiscal instability and market shocks?

The BoJ’s current approach is cautious tapering, but rapid market shifts and fiscal pressures could force more dramatic intervention.

What’s Next? Three Possible Paths

    1. Soft Drift (Most Likely)
      Yields rise gradually, capital repatriation remains slow, and global markets adjust without much disruption.
    2. The Volatility Loop (Increasingly Probable)
      Periodic yield spikes, yen surges, unwind of carry trades, and intermittent BoJ intervention.
    3. Disorderly Repricing (Low Probability, High Impact)
      A sharp yen rise, large foreign-asset selling, global yield spikes, and broader market turbulence.

The mere existence of this third scenario is enough to make global allocators watch Japan very closely.

Why Should We Care?

Japan’s bond market is no longer an isolated story; it is a global inflection point.

This shift affects borrowing costs in India and emerging markets, introduces volatility in currency markets, and challenges risk pricing globally.

The era of Japan as the world’s cheapest capital source is ending.

How governments, markets, and investors navigate this new terrain will define and shape global financial markets for years to come.

The Takeaway

Japan’s rising bond yields are a wake-up call from the land that built global liquidity — a structural shift in global finance now reshaping the next decade’s financial landscape.

The decades-long story of ultra-low interest rates and silent capital flight is unwinding, with consequences rippling far beyond Japan’s shores.

For investors, policymakers, and markets, this is a moment to watch closely, understand deeply, and prepare accordingly.

Thanks for reading this Sunday Shot. Remember, behind every macro shift is a story — and Japan’s story is one every global investor should know.

Until Next Sunday!

Disclaimer: This update is for informational purposes only. Please consult a SEBI-registered advisor before investing.

AI’s Trillion-Dollar Story — Between Rocket Ship and Red Flags

AI Trillion Dollar

AI has become the hottest — and riskiest — bet in global markets.

Nvidia has powered past ~$5 trillion in valuation. OpenAI’s IPO whispers now circle $1 trillion. And Oracle, SoftBank, Microsoft, and AWS are pouring hundreds of billions into data centres the size of small towns.

The excitement is real. So is the unease.

Because behind the headlines lies a number that has quietly changed the tone of the entire AI conversation: $1.4 trillion.

That’s the infrastructure commitment OpenAI has taken on through its partnerships — a figure Sam Altman confirmed in a single understated line on X.

For context: $1.4 trillion is roughly one-third of India’s annual GDP (~$4 trillion).

And this is where the rocket ship meets reality.

The Blast-Off: How the Boom Started

If AI is the rocket, Nvidia is the engine. Its chips power nearly every leading model — from copilots to chatbots to autonomous agents.

A ~$5 trillion valuation places it above the nominal GDP of countries like india, UK or Japan. It’s extraordinary.

OpenAI, meanwhile, has become the mind of the movement — a company whose products are used by millions and whose ambitions now shape policy, energy grids, and capital markets. A trillion-dollar IPO no longer sounds unrealistic.

Oracle is the launchpad — committing multi-hundred-billion sums to build AI-first data centres across America. These are not warehouses; they are industrial-scale energy machines.

With Nvidia committing multi–tens-of-billions in Graphics Processing Units (GPUs) supply commitments for these data centres, and OpenAI’s $1.4 trillion commitments overlap with the multi-hundred-billion ($500B-scale) Stargate initiative, this tech and capital alliance is historic in scale.

Nvidia - Open AI - Oracle : An Investment Loop.

Threaded through this momentum is a more subtle dynamic: an investment loop.

Nvidia invests in OpenAI. OpenAI buys Nvidia hardware. Oracle builds data centres powered by Nvidia chips.

A circular flow of capital that amplifies growth — and concentrates risk. Yet with every milestone comes a question the market cannot shake:

Are these valuations supported by earnings — or expectations?

SoftBank sold its reported ~$5.8B stake in Nvidia and has redeployed capital toward OpenAI and related infrastructure plays, while Oracle’s build-out has increased balance-sheet exposures — signs that some investors are re-allocating risk.

But the real turning point came from an entirely different direction.

The $1.4 Trillion Shock: Where Ambition Meets Arithmetic

OpenAI’s commitments over the next eight years total $1.4 trillion — through partnerships with Microsoft, AWS, Oracle, and nuclear-energy developers.

But here’s the math:

    • Projected 2025 revenue: ~$20 billion
    • JP Morgan’s estimate of annual revenue needed to justify this scale: ~$650 billion
    • Required growth: unprecedented

Even optimistic Wall Street models require near-perfect execution and sustained 40–50% annual growth. And that’s before considering competition.

OpenAI’s moat isn’t what it used to be. GPT-4, once the industry’s gold standard — is now ranked 95th across global benchmarks. Google undercuts OpenAI on price. Meta gives away models for free.

Costs are exploding. Pricing power is shrinking.

This is the tension markets are waking up to.

The Voice of Caution: Michael Burry Steps In

Michael Burry — the investor who predicted the 2008 crash, has quietly taken one of the largest bearish positions of his career.

His portfolio is now dominated by put options against Nvidia and Palantir, signalling a belief that valuations have run far ahead of fundamentals.

And just days later, Burry deregistered Scion Asset Management — stepping away from managing public money as he warned about distortions in markets that “no longer price risk normally.”

To investors, this wasn’t noise. It was a flare.

The last time Burry walked away from a crowded narrative, it ended up in a book and a movie.

Market Signals: Bubble or Breakthrough?

AI companies now represent nearly 30% of the S&P 500’s value — the highest concentration seen since past bubble cycles.

Forward valuations hover far above long-term averages. Many AI firms are still burning cash and borrowing heavily for data-centre buildouts.

And the momentum is fragile: roughly $1.6 trillion in AI market value evaporated within days last week.

Supply chains are stretched. Energy systems are stressed. Regulation is tightening.

Yet the biggest constraint may not be capital or competition — but physics.

The Energy Problem No One Saw Coming

AI doesn’t just consume capital. It consumes electricity — at breathtaking scale. By 2030, AI workloads could more than double U.S. electricity demand, according to DOE and IEA projections.

To meet that demand, America would need the equivalent of 25–30 new nuclear power plants — in a country where building even one can take a decade. Regions hosting major AI clusters — Virginia, Oregon, Iowa, are already showing signs of grid strain. Inference (daily model usage) is 10× more energy-intensive than training.

This has triggered a nuclear rush:

    • Microsoft exploring a restart of the Three Mile Island reactor
    • Amazon investing in SMR nuclear technology
    • Google partnering with Kairos Power

Not for climate reasons. For survival.

Without new power, the AI boom stalls — regardless of revenue.

The Invisible Bailout: Support Without Saying “Bailout”

Sam Altman insists OpenAI needs no bailout. Technically, he’s right. There is no direct cheque. But around OpenAI, a quiet architecture of support has emerged:

    • Loan guarantees for nuclear plants powering AI data centres
    • CHIPS Act extensions applied to AI infrastructure
    • Tax credits that reduce capital cost
    • Priority grid access
    • Accelerated permitting

This isn’t corporate welfare by name. But it is industrial policy by mechanism.

The public absorbs long-term risk. Private investors capture the upside.

Bigger Picture: Immense Opportunity — So Are the Stakes

AI will likely transform industries, productivity, and economies.

Private investment crossed $100 billion last year. Governments are racing to build frameworks for an AI-first world. But the scale now rivals national infrastructure:

Nvidia is now worth more than entire countries.
OpenAI is shaping trillion-dollar energy decisions.
And Taxpayers, knowingly or not — have become minority partners in this wager.

Looking Ahead

AI’s trillion-dollar story is still being written.

It may become the defining technological breakthrough of our lifetime —

or a powerful reminder that even the most ambitious innovations must answer to economics, competition, and physics.

Either way, it’s a Journie worth watching closely.

Until next Sunday!

Disclaimer: This update is for informational purposes only. Please consult a SEBI-registered advisor before investing.

From Legacy to Launch-Pads: Inside India’s Family-Office Revolution

India’s Family Office

A New Chapter in India’s Wealth Story

If you walk into any quiet boardroom in Mumbai, Delhi or Chennai these days, you’ll notice the change. The conversations have shifted.

What once revolved around fixed deposits, real estate, and tax efficiency now sounds very different — startups, offshore diversification, co-investment opportunities.

The new generation isn’t asking “How do we preserve wealth?” anymore.
They’re asking, “How do we grow it better, smarter, and for the long run?”

Welcome to the rise of India’s modern family offices — a transformation that’s redefining how India’s wealth is managed, multiplied, and passed on.

The Numbers Tell Their Own Story

In 2018, India had barely 45 structured family offices.
Today, that number has crossed 300, managing over $100 billion in assets.

According to a recent EY–Julius Baer study, three out of four family offices now prioritize active investing — venture capital, private equity, alternatives, even global exposure — over simple capital preservation.

Behind those numbers lies a much larger story.
India is on the cusp of a $1.3 trillion inter-generational wealth transfer over the next decade. The number of ultra-wealthy families is expected to rise from 13,000 today to nearly 19,000 by 2028.

So it’s not just more money being managed — it’s a new generation deciding how it should be managed.

From Preservation to Participation

Walk into a family-office meeting today and the energy feels different.

The older generation still discusses fixed income and gold. The next generation talks about fintech, clean energy, AI, and cross-border funds.

They’re not waiting for opportunity to come knocking — they’re writing the cheques that build it.

Family offices now account for nearly 30% of startup funding in India’s venture ecosystem (IBEF 2025). In some cases, they’re investing directly; in others, they’re partnering with institutional funds or co-investing with global peers.

💬 As one young family-office principal put it, “My grandfather built factories; my father built real estate; I’m building cap tables.”

It’s not about risk for the sake of adventure. It’s about relevance — being part of the industries that will define the next India.

Why Now?

Three shifts explain this transformation:

    1. Generational Transition: A younger, globally-educated generation is more comfortable with venture investing and tech disruption than with fixed income.
    2. Structural Clarity: Jurisdictions like GIFT City are giving families regulatory and tax-efficient options to manage global portfolios.
    3. Professionalisation: The old “CA and banker” model is giving way to dedicated CIOs, analysts, and governance boards — running wealth like an institution, not a household.

Legacy Meets the Digital Era

Technology has quietly become the backbone of this evolution.

Dashboards track portfolios across continents in real time. ESG filters help align capital with conscience. Analytics, reporting, and compliance are now as seamless as a swipe.

The family office today looks less like a private vault and more like a data-driven investment engine — blending the heart of legacy with the head of modern finance.

And it’s not just the young driving this; the seniors see the sense too.
When you’re managing across generations, visibility is peace of mind.

Global Ambition, Indian Roots

Globally, family offices manage over $7 trillion — and more than 28% of them are looking to increase exposure to India in the next 12 months (UBS 2025).

At the same time, Indian families are going global — setting up in Singapore, Dubai, and GIFT City to access better deal flow and diversify currency and risk.

It’s a two-way bridge: the world is investing into India, while Indian capital is learning to think like the world.

That’s a big leap — from local custodians to global allocators.

The Cultural Shift: From Inheritance to Intention

All this points to something deeper than financial strategy.
It’s cultural.

India’s wealth story is moving from first-generation creation to multi-generation stewardship.

We’re seeing:

    • Families forming governance boards and investment committees,
    • Collaborations between UHNW families for co-investments, and
    • A growing emphasis on purpose and impact, not just profit.

In many ways, these family offices are becoming India’s new private institutions — agile, ambitious, and quietly powerful.

Looking Ahead 💭

Legacy isn’t just what you leave behind — it’s what you continue to shape.

Indian family offices are rewriting their wealth stories — moving from protecting capital to creating it, from holding assets to shaping industries.

This new investing journey belongs to those who see progress as the truest heirloom.

At Journie, we believe these stories are reshaping India’s wealth landscape — and crafting modern solutions for the next generation of wealth creators.

Until next Sunday, here’s to those who build with intent, and invest with conviction.

Disclaimer: This update is for informational purposes only. Please consult a SEBI-registered advisor before investing.

Hedging, Hindsight & the Myth of Perfect Timing

Imagine you’re the CFO of India’s largest silver producer. You study charts, consult experts, and hedge one-third of your future silver output at $37/oz — prudent, right? The numbers add up. The analysis is thorough. Everything looks airtight… until the market rewrites the script.

Fast forward a few months, and silver has rocketed to a multi-year high of $50/oz. Suddenly, your “safe” hedge turns into a missed windfall — and a humbling lesson in how elusive perfect timing truly is.

That’s exactly what played out recently at Hindustan Zinc, which hedged part of its second-half silver production just before prices surged to multi-year highs.

But this isn’t just about a company or a commodity. The same story plays out on Dalal Street, Wall Street, corporate boardrooms — and on your smartphone feed.

Whenever we attempt to outsmart the market, history leans in and whispers: “Nobody’s got the magic clock.”

The Market’s Cruel Irony

Let’s rewind to some headline moments:

    • Black Monday (1987) : One terrible day triggers mass panic. Sell-offs mount. Then, just two days later — the market snaps back by more than half. Many who quit early missed the comeback entirely.
    • Dot-Com Bust (early 2000s) : Tech stocks crash, retail flees, losses lock in. A sharp rebound follows. Those who left early never fully catch up.
    • Post-2008 Crisis : Millions swear off equities at the trough — just before a decade-long bull run quietly begins.
    • COVID-19 Crash (2020) : Pandemic panic. Markets collapse. Those who sold and sat on the sidelines saw a historic rebound unfold months later.

The irony? These “magic” recovery days happen when most investors are gripped by fear and sitting on the sidelines.
The story is the same: fear → exit → rebound → regret.

A handful may call the bottom. The majority, data shows, end up lagging those who just stuck with their plan.

Data Doesn’t Lie: The High Cost of Missing Out

Here’s the jaw-dropper: missing even a handful of the best market days over decades can halve your lifetime return.

    • Stay invested in the S&P 500 (1970–1996) and you’d see around 12.3% annualized returns. Miss the best 12 months and returns fall to ~7.2%.
    • From 1995–2024, missing the 10 best days cuts lifetime returns almost in half.
    • Schroders found £1,000 invested in the FTSE 250 (since 1989) could have grown to £26,831 by 2019. Miss the 30 best days and you’d see just £7,543.

No one sees those days coming — they often pop up when they’re least expected.
Markets don’t wait for comfort. The rebound begins while most are still nervous.

India’s Own Timing Trap

And if you think this is just a global story — think again. India’s markets tell the same tale.

What if someone told you that missing just 10 trading days in India’s equity market could cost you ₹2.96 Crore on a ₹1 Crore investment? Sounds exaggerated — but the data doesn’t lie.

And when do these “magic” days happen

    • During crises and panic (2008, 2020)
    • During high-volatility events (2024 election cycle)

Precisely when most investors have exited, waiting for clarity. By the time the smoke clears, the rally’s often already done.

No one knows which 10 days will make you rich. If they did, they’d all be billionaires.

Why We Keep Trying (And Why It Fails)

    • We crave control.
      Predicting a buy-low, sell-high feels empowering. But markets move for countless reasons — sentiment, policy, macro shocks — making timing nearly impossible.
    • Our emotions betray us.
      Losses hurt more than gains feel good. When markets fall, our instinct is to exit; yet many of the best rebound days come when fear is highest. Those are often the very days fortunes are made.
    • We misread risk.
      Even the best decision-makers (think corporates hedging output) can misjudge price swings. Investing isn’t textbook risk management — it’s about letting compounding work over time.

Nobel laureate William Sharpe calculated: you’d need about 74% accuracy in timing calls just to match a simple buy-and-hold allocation. That’s not investing — it’s roulette.

So, What Actually Works?

The blueprint is less glamorous. The secret, if there is one, is boringly effective:

    • Stay invested. Time is an ally: the longer capital stays invested, the better compounding works.
    • Pick a sensible asset mix. Diversify across geographies, sectors, and styles.
    • Rebalance, but don’t obsessively tinker. Do it when your goals or horizon of the goal change — not when headlines scream.
    • Accept that even experts get it wrong. Volatility is part of the journey.
    • Avoid chasing perfect timing. True resilience comes not from predicting the move, but from enduring it and letting compounding quietly do its work.
The Lesson Beneath the Noise

“In investing, what feels smart in the moment often fails the test of time. The winners aren’t the best forecasters — they’re the most consistent.”

Let the silver hedging saga be a reminder: Your strategy, not your predictions, will shape your destination.

If you know someone still waiting for the “right time,” share this.

As market veterans often say: “Time in the market matters far more than timing the market.”

Disclaimer: This update is for informational purposes only. Please consult a SEBI-registered advisor before investing.

Elevate the Way You Manage Your Wealth

For a trusted wealth experience—powered by people and technology, crafted around you.

Join the Journie

Subscribe to Journie Shots — thoughtful, well-curated insights and market stories delivered every Sunday.