Perhaps It Is Both at the Same Time.
History rarely moves in straight lines. Every transformative technology creates periods of excess before finding stability. Railroads did. Dot-com companies did. Smartphones did.
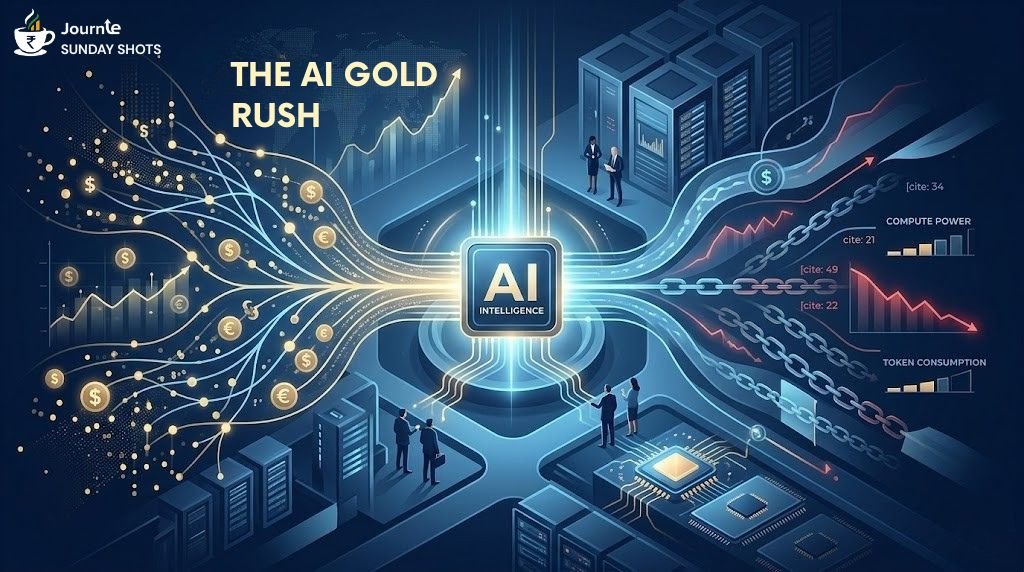
Artificial intelligence is unlikely to be different.
The boom is unquestionably real. The capital, valuations, infrastructure expansion, and enterprise adoption prove that much.
But so do the concerns. Rising costs, margin pressure, overdependence on expensive chips, and uncertain monetization models are becoming impossible to ignore.
And yet, dismissing AI as merely another bubble may ultimately prove just as shortsighted. Because unlike speculative technologies of the past, AI is already reshaping workflows, software economics, global semiconductor demand, and corporate strategy in real time.
This is not a future story anymore. The AI revolution has already begun. The only question now is who emerges stronger once the excitement settles and the real economics finally arrive.
See you next Sunday, for another Shot of insights.!