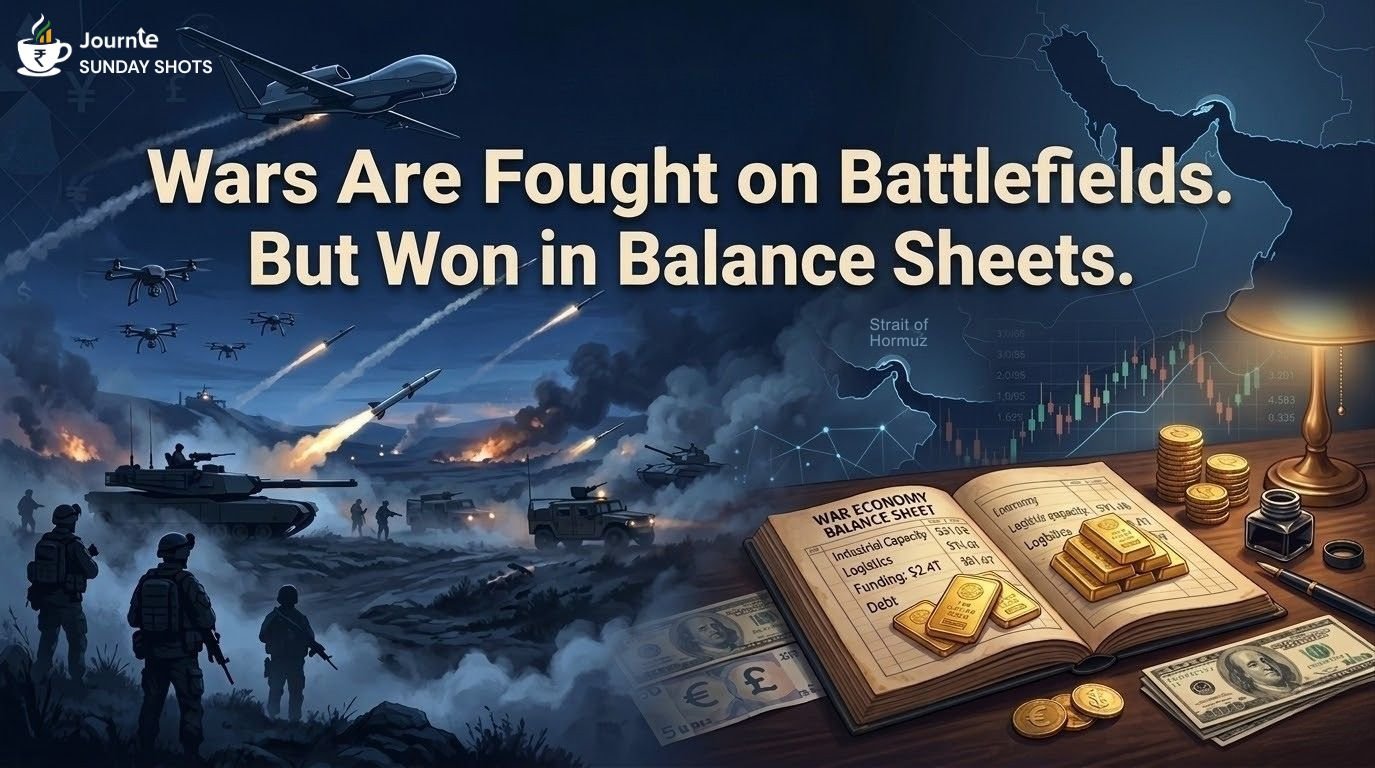
The Invisible Battlefield
Every war is fought on two fronts. The visible one is the battlefield. The invisible one is the economy.
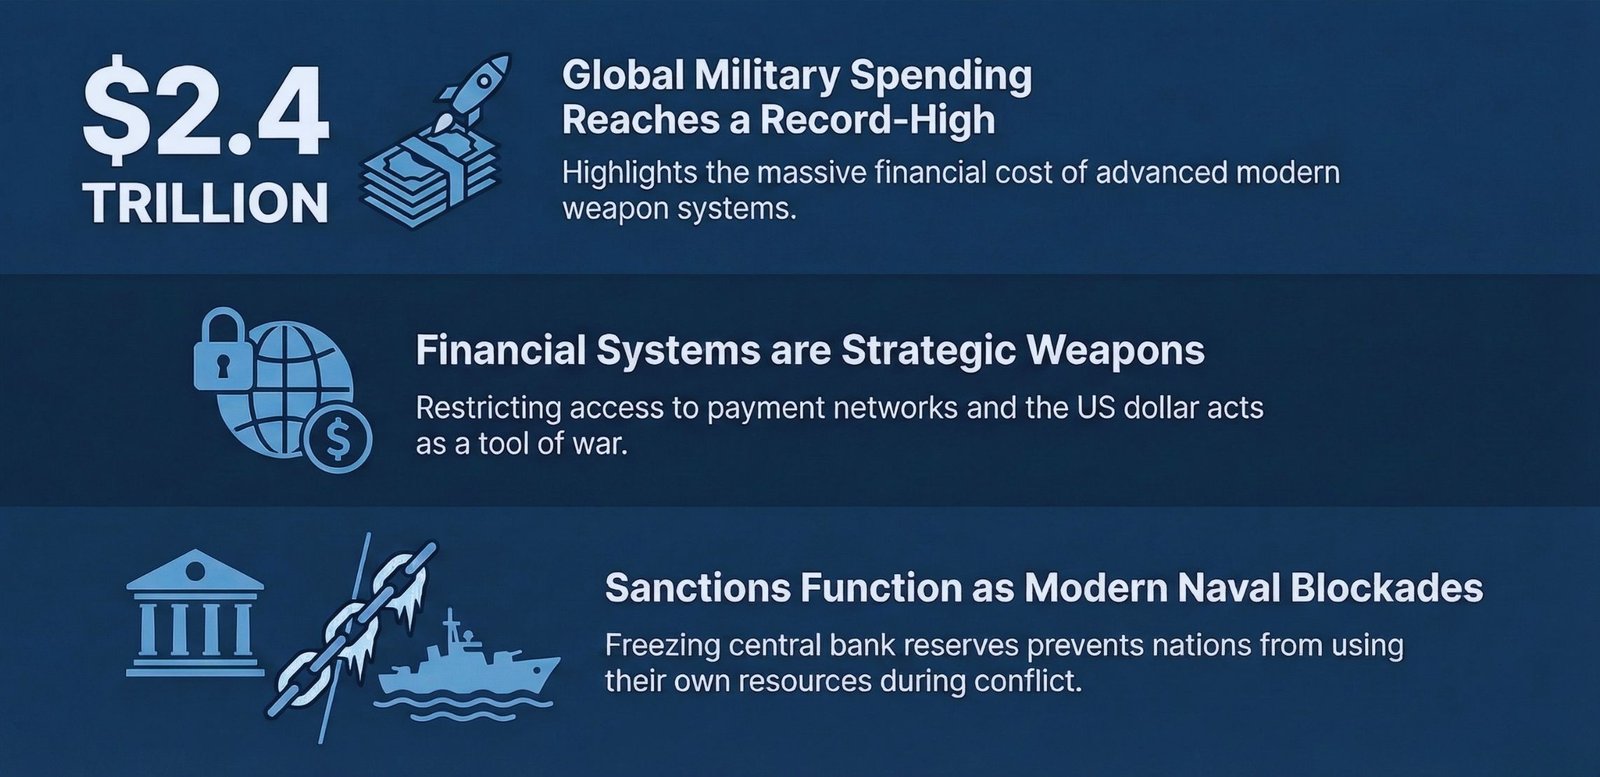
Sustaining a war requires factories, fuel, logistics, and above all, financing.
As Napoleon once famously said: An army marches on its stomach.
Modern economists might add something else: An army also marches on capital markets.
History keeps repeating the same lesson: Wars may begin with politics, but they are sustained—and often decided—on balance sheets.
Because in the end, wars may be fought by soldiers, but they are financed by economies.
Until next Sunday!