Startup India: A Decade That Reshaped Indian Entrepreneurship (2016–2026)
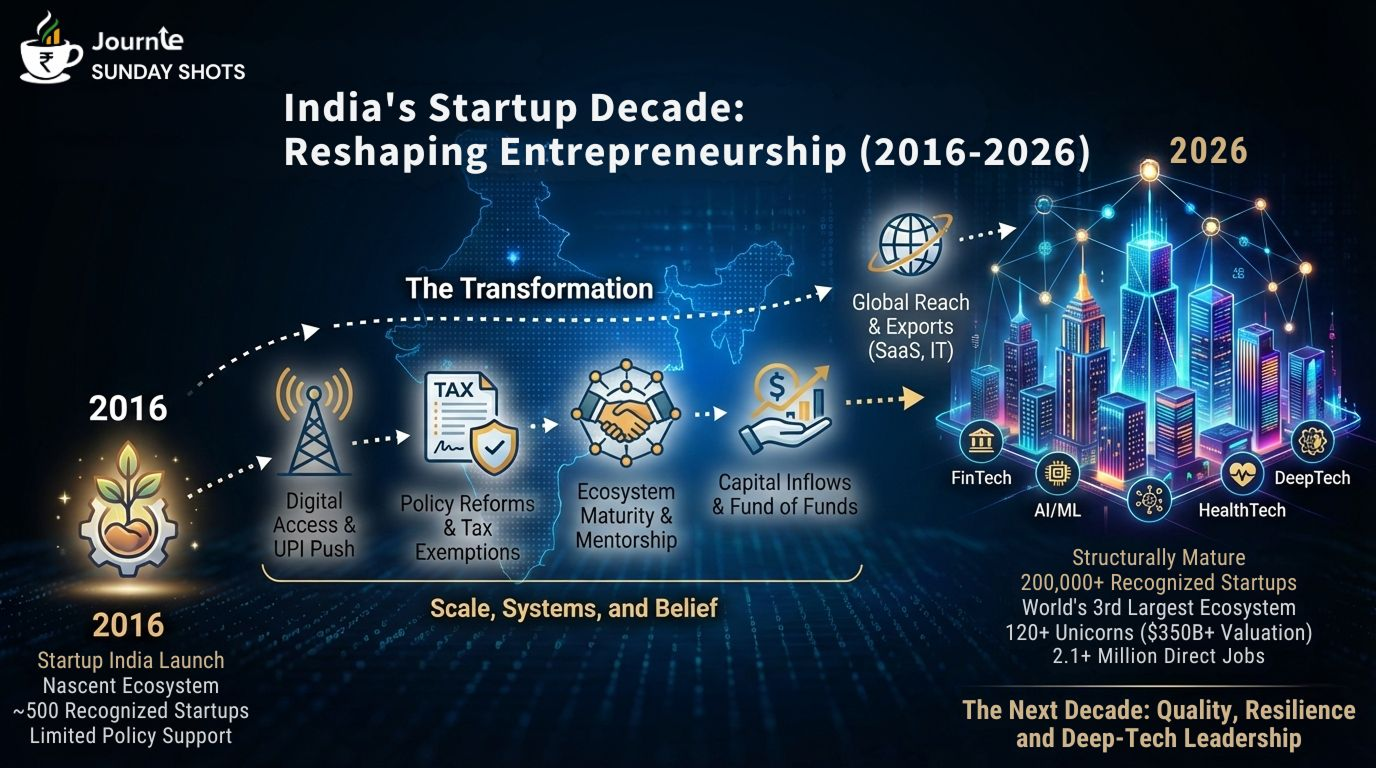
On January 16, 2016, the Government of India launched Startup India with a clear and ambitious mandate: to formalize entrepreneurship, catalyze innovation, and build a robust startup ecosystem.
A decade later, as National Startup Day 2026 marks this milestone, India’s startup story stands at a meaningful inflection point — from fragmented enterprise creation to one of the largest and structurally mature startup ecosystems in the world.
This is not just a story of scale. It is a story of systems, belief, and economic intent.
Early Foundations: Before Startups Had a Name
India’s startup story did not begin in 2016.
Its roots stretch back decades, shaped by technology, liberalization, and infrastructure.
In 1968, Tata Consultancy Services (TCS) was founded, emerging as one of India’s earliest pioneers in computer services. Long before “startup” entered the mainstream lexicon, TCS demonstrated that technology-led enterprises could be built, scaled, and exported from India.
The next inflection point came in 1991, when economic liberalization unlocked private enterprise. It enabled the growth of domestic financial institutions, expanded competitive markets, and allowed Indian technology firms to operate in a more globalized environment.
Subsequent infrastructure shifts compounded this momentum. The broadband push in the early 2000s expanded digital access, while the launch of UPI in 2016 dramatically accelerated innovation in fintech, e-commerce, and platform-led businesses.
Startup India did not invent entrepreneurship. It organized it, accelerated it, and gave it institutional form.
From Nascent Beginnings to an Ecosystem
By 2016, despite decades of entrepreneurial activity, India’s startup landscape remained embryonic.
Just 452 startups were officially recognized by the Department for Promotion of Industry and Internal Trade (DPIIT). Policy support was fragmented, access to early capital limited, and regulatory frameworks were largely designed for incumbents rather than innovators.
Startup India sought to change this foundation.
What Shifted
- Simplified compliance and self-certification
- Three-year tax exemptions for eligible startups
- Faster IP and patent processing
- Structured mentorship platforms such as MAARG
- Seed funding and credit support mechanisms
Startup India’s most important contribution wasn’t capital. It was coherence.
Entrepreneurship finally had a lifecycle framework.
Scale That Redefined the Map
Over the next decade, the ecosystem expanded rapidly, and unevenly in all the right ways.
Key Markers
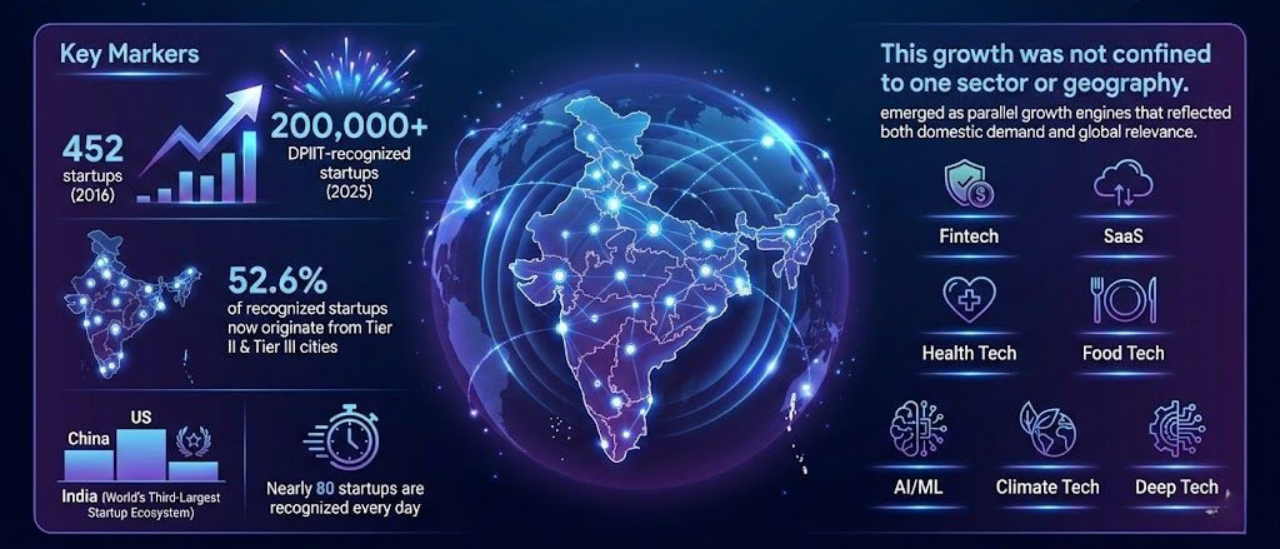
- 452 startups (2016) → 200,000+ DPIIT-recognized startups (2025)
- 52.6% of recognized startups now originate from Tier II & Tier III cities
- India consistently ranks as the world’s third-largest startup ecosystem, after the US and China
- Nearly 80 startups are recognized every day
This growth was not confined to one sector or geography.
Fintech, SaaS, health tech, food tech, AI/ML, climate tech, and deep tech emerged as parallel growth engines that reflected both domestic demand and global relevance.
Unicorns: From Exceptions to Outcomes
One of the most visible signals of ecosystem maturity has been the rise of unicorns. The startups valued at over $1 billion.
Unicorn Snapshot
- 120+ unicorns as of January 2026.
- Combined valuations exceeding $350 billion.
- Presence across fintech, enterprise software, mobility, e-commerce, and consumer technology
Notably, India’s first unicorn pre-dated Startup India.
In 2011, InMobi, a global mobile advertising platform, crossed the $1-billion valuation mark, five years before the policy launch.
Startup India didn’t create ambition. It ensured ambition would no longer remain an exception.
Capital: From Abundance to Discipline
While Startup India cannot claim credit for all capital inflows, it played a decisive signaling role by reassuring domestic and global investors that entrepreneurship in India was institutionally supported.
A ₹10,000-crore Fund of Funds, managed through SIDBI, catalyzed over ₹90,000 crore in downstream investments — illustrating how targeted public capital can unlock private participation.
By 2025, India also emerged as one of the world’s most active IPO markets, with 35+ startup and VC-backed listings, alongside $135 billion FDI commitments from global tech giants
As global liquidity tightened, the ecosystem entered a correction phase.
This was not regression. It was maturation. Growth-at-any-cost gave way to capital efficiency, governance discipline, and clearer paths to profitability and exits.
Jobs and the Real Economy
Beyond valuations and funding rounds, startups have begun to demonstrate tangible economic impact.
Employment Impact
- 2.1+ million direct jobs created by DPIIT-recognized startups as of January 2026, spanning IT services, healthcare, and commercial services
- This translates to an average of ~11 jobs per startup
These figures exclude indirect employment across supply chains, platform work, and professional services, effects that are real but harder to quantify.
GDP Linkages
While precise attribution remains complex, startups are now a measurable contributor to India’s GDP, not merely an innovation layer.
In 2023, startups contributed an estimated ~$35 billion, or roughly 1–1.2% of GDP. This is projected to rise to ~$120 billion by 2030 (around 1.5–2% of GDP), driven by scale, formalization, and productivity gains.
This contribution is reflected through:
- Accelerated formalization of informal sectors
- Productivity improvements via digital adoption
- Globally competitive export businesses, particularly in SaaS and IT services
A Necessary Reality Check
The decade was not friction-free.
- 6,000+ startups shut down in 2025 alone
- Early-stage funding tightened sharply after the boom years
- Many ventures struggled with unit economics and durable business models
Every serious ecosystem needs a winter. India’s separated builders from storytellers.
Failure at scale is not weakness. It is market evolution.
Beyond the Numbers: Structural Shifts
Several quieter but consequential shifts defined this decade:
1. Democratization of Entrepreneurship
Startup formation expanded far beyond Bengaluru, Mumbai, and Delhi, with sustained momentum from smaller cities and emerging state ecosystems.
2. Sectoral Breadth
While fintech and software lead, deep tech, health tech, climate solutions, and food processing are gaining traction.
3. Inclusion
The number of women founders and directors has steadily increased, reshaping leadership demographics.
4. Policy–Private Capital Synergy
Public frameworks reduced friction; private capital introduced discipline, governance, and global benchmarks.
The Next Decade: From Scale to Strength
If the first decade was about scale, the next must be about quality and resilience. India is targeting 280 unicorns, 50 million jobs, and deep-tech leadership in AI, climate, defence, and space through Startup India’s new iteration.
Priorities are clear:
- Profitability over valuation milestones
- Reliable exit pathways via IPOs and acquisitions
- Innovation that addresses healthcare, climate, and agricultural productivity
Looking Ahead: From Momentum to Maturity
Startup India’s first decade has been transformational in terms of scale, ecosystem maturation, and global positioning. India today:
- Is one of the world’s largest startup ecosystems
- Has hundreds of thousands of recognized startups
- Hosts 100+ unicorns with global valuations and impact
- Has attracted meaningful capital and built credible exit pathways
But this is a checkpoint, not the destination.
The real value will come from sustainable businesses that create jobs, exports, solutions to core problems, and long-term economic resilience.
That’s the lens India needs for the next decade: less vanity, more value.
Until Next Sunday!
Disclaimer: This update is for informational purposes only. Please consult a SEBI-registered advisor before investing.